


 27 / 132

25
EC World Real Estate Investment Trust ANNUAL REPORT 2016
Property
Lease terms
Rental escalation
Fu Heng Warehouse
Master lease:
From 1/1/2016 to 31/12/2020
6.0%, 5.0%, 4.0% and 3.0% on 1st Jan of 2017, 2018,
2019 and 2020 respectively.
Stage 1 Properties of
Bei Gang Logistics
Master lease:
From 1/11/2015 to 31/10/2020
1% per annum
Chongxian Port Investment Master lease:
From 1/1/2016 to 31/12/2020
6.0%, 5.0%, 4.0% and 3.0% on 1st Jan of 2017, 2018,
2019 and 2020 respectively
Chongxian Port Logistics Multiple tenancies
(1) 75% of leases: increase of 10% in first 3 years,
12% from the fourth year;
(2) 20% of leases: increases up to 5%, annually
Fu Zhuo Industrial
1)25 Apr 2015 to 24 Apr 2020
2) 8 Oct 2014 to 7 Oct 2029
(1) 10% in first 3 years, 15% starting from the 4th year
(2) 7.5% every 3 years
Hengde Logistics
1) 15 Oct 2015 to 14 Oct 2020
2) 9 May 2016 to 8 May 2021
2 main leases. Up to 10% upon renewal
Property
Commencement date of
Master Lease Agreements
Gross revenue (received from Listing Date
to 31.12.16 (inclusive of VAT) (RMB’000)
Fu Heng Warehouse
1 Jan 2016
17,652
Stage 1 Properties of Bei Gang Logistics
1 Nov 2015
53,020
Chongxian Port Investment
1 Jan 2016
60,232
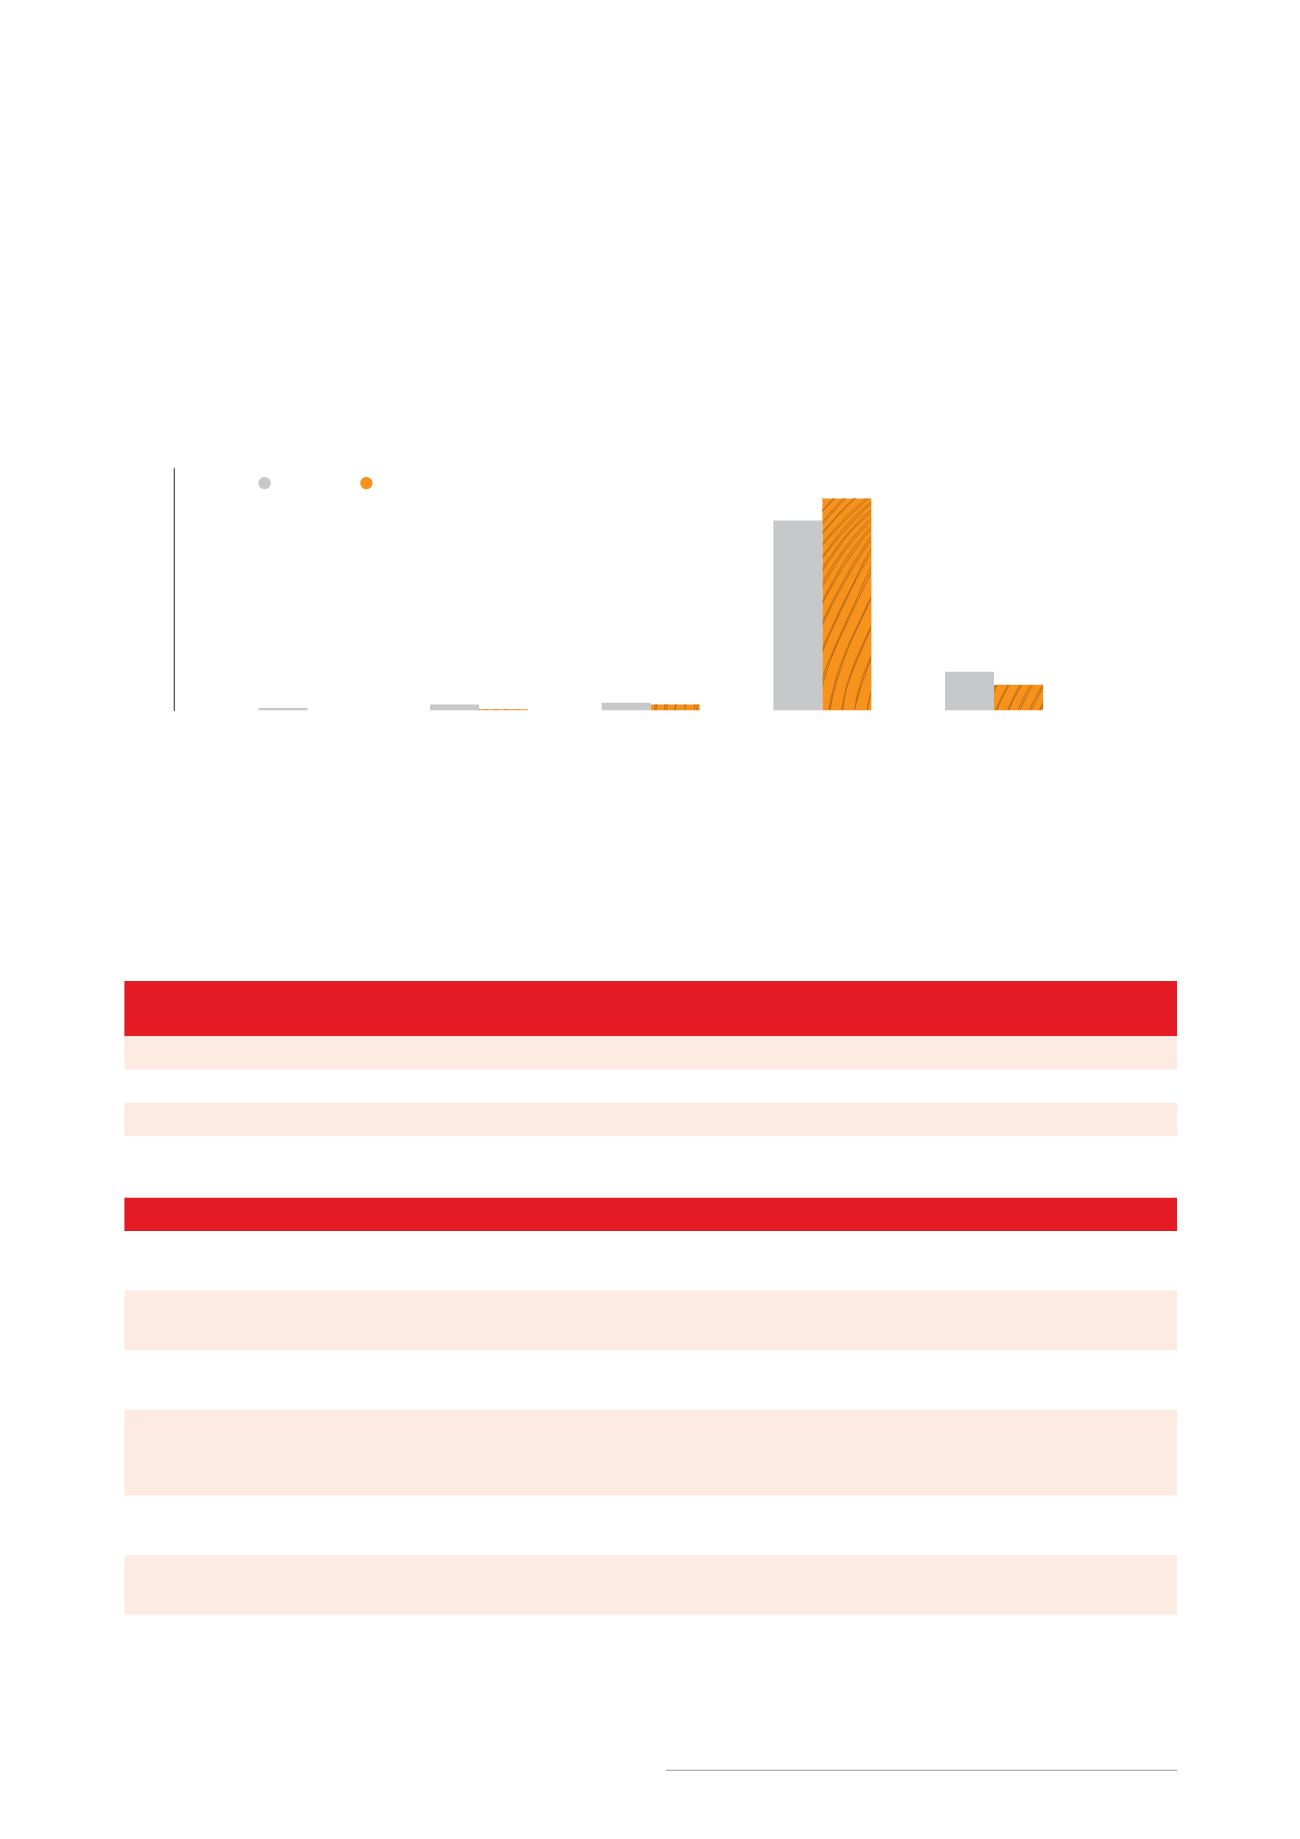
Lease Expiry Profile: No significant space expiring in the next 3 years
0
100
80
60
20
40
FY2017
FY2018
FY2019
FY2020
FY2021 and beyond
0.0%
0.4%
2.3%
86.8%
10.5%
0.9%
2.4%
3.1%
77.8%
15.8%
by NLA by Gross Rental Income
During the period 28 July 2016 to 31 December 2016, the
portfolio earned RMB186.3 million of gross rental income
and 2.454 cents was paid in DPU to unitholders. Without
master leases, gross rental income and DPU would have
been RMB146.4 million and 1.845 cents respectively.
The majority of the leases have built-in rental escalation.
Organic growth from rental escalation alone is expected
to be between 4-5% per annum for the entire portfolio.
The expiry profile of leases that were locked in as at 31 December 2016 are shown in the chart below.